hicPlotTADs
Description
For parameter options please see the pyGenomeTracks documentation.
Usage example
The hicPlotTADs output is similar to a genome browser screenshot that besides the usual genes and score data (like bigwig or bedgraph files) also contains Hi-C data. The plot is composed of tracks that need to be specified in a configuration file. Once the track file is ready, hicPlotTADs can be used as follows:
$ hicPlotTADs --tracks tracks.ini --region chrX:99,974,316-101,359,967 \
-t 'Marks et. al. TADs on X' -o tads.pdf

Configuration file template
The following is a template for the configuration file which is based on .ini configuration files. Each track is defined by a section header (for example [hic track]), followed by parameters specific to the section as color, title, etc. For details please see the documentation of pyGenomeTracks.
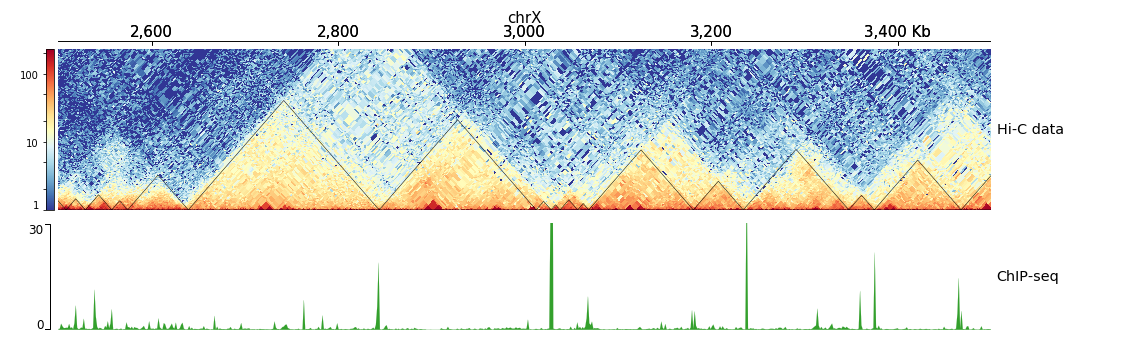
$ hicPlotTADs --tracks hic_track.ini -o hic_track.png --region chrX:2500000-3500000
[x-axis]
where = top

[hic matrix]
file = hic_data.h5
title = Hi-C data
# depth is the maximum distance plotted in bp. In Hi-C tracks
# the height of the track is calculated based on the depth such
# that the matrix does not look deformed
depth = 300000
transform = log1p
file_type = hic_matrix

[tads]
file = domains.bed
file_type = domains
border_color = black
color = none
# the tads are overlay over the hic-matrix
# the share-y options sets the y-axis to be shared
# between the Hi-C matrix and the TADs.
overlay_previous = share-y

[spacer]

[bigwig file test]
file = bigwig.bw
# height of the track in cm (optional value)
height = 4
title = ChIP-seq
min_value = 0
max_value = 30