hicFindTADs
Usage example
It is mandatory to test multiple parameters of TAD calling with hicFindTADs before making conclusions about the number of TADs in a given sample or before comparing TAD calling between multiple conditions. In order to compare numerous TAD calling parameters at once, it is recommended to use hicPlotTADs.
Below you can find a typical command-line to use hicFindTADs:
$ hicFindTADs -m myHiCmatrix.h5 \
--outPrefix myHiCmatrix_min10000_max40000_step1500_thres0.05_delta0.01_fdr \
--minDepth 3000 \
--maxDepth 31500 \
--step 1500 \
--thresholdComparisons 0.05 \
--delta 0.01 \
--correctForMultipleTesting fdr \
-p 64
This command will output the following files:
myHiCmatrix_min3000_max31500_step1500_thres0.05_delta0.01_fdr_boundaries.bed
myHiCmatrix_min3000_max31500_step1500_thres0.05_delta0.01_fdr_boundaries.gff
myHiCmatrix_min3000_max31500_step1500_thres0.05_delta0.01_fdr_domains.bed
myHiCmatrix_min3000_max31500_step1500_thres0.05_delta0.01_fdr_score.bedgraph
myHiCmatrix_min3000_max31500_step1500_thres0.05_delta0.01_fdr_score.npz
myHiCmatrix_min3000_max31500_step1500_thres0.05_delta0.01_fdr_tad_score.bm
myHiCmatrix_min3000_max31500_step1500_thres0.05_delta0.01_fdr_zscore_matrix.h5
TAD boundaries location is stored in the boundaries files, domains.bed file contain the TADs location, score files contain TAD separation score, or the so-called TAD insulation score, in various formats. As a side note, the tad_score.bm file is a bedgraph matrix that can be used to display TAD separation score curves in :doc:hicPlotTADs for example.
The zscore_matrix.h5 file contain a z-score matrix that is useful to quickly test the –thresholdComparisons, –delta and –correctForMultipleTesting parameters by using the –TAD_sep_score_prefix option pointing to this zscore_matrix.h5 file. For example to quickly test a –thresholdComparisons of 0.01 instead of 0.05 we can run the following command:
$ hicFindTADs -m myHiCmatrix.h5 \
--outPrefix myHiCmatrix_min10000_max40000_step1500_thres0.01_delta0.01_fdr \
--TAD_sep_score_prefix myHiCmatrix_min10000_max40000_step1500_thres0.001_delta0.01_fdr_zscore_matrix.h5
--thresholdComparisons 0.01 \
--delta 0.01 \
--correctForMultipleTesting fdr \
-p 64
As you can see above, –minDepth, –maxDepth and –step are ignored because these parameters are used to calculate the z-score matrix which is here provided to –TAD_sep_score_prefix. Since z-score matrix computation is the most demanding step of hicFindTADs in terms of memory and computation, the above command will thus run significantly faster than the previous one.
Multiple combination of parameters can be tested that way with only one z-score matrix computation. To compare these different TAD callings, we use hicPlotTADs with the following command using, for example, the following tracks.ini file:
- command line:
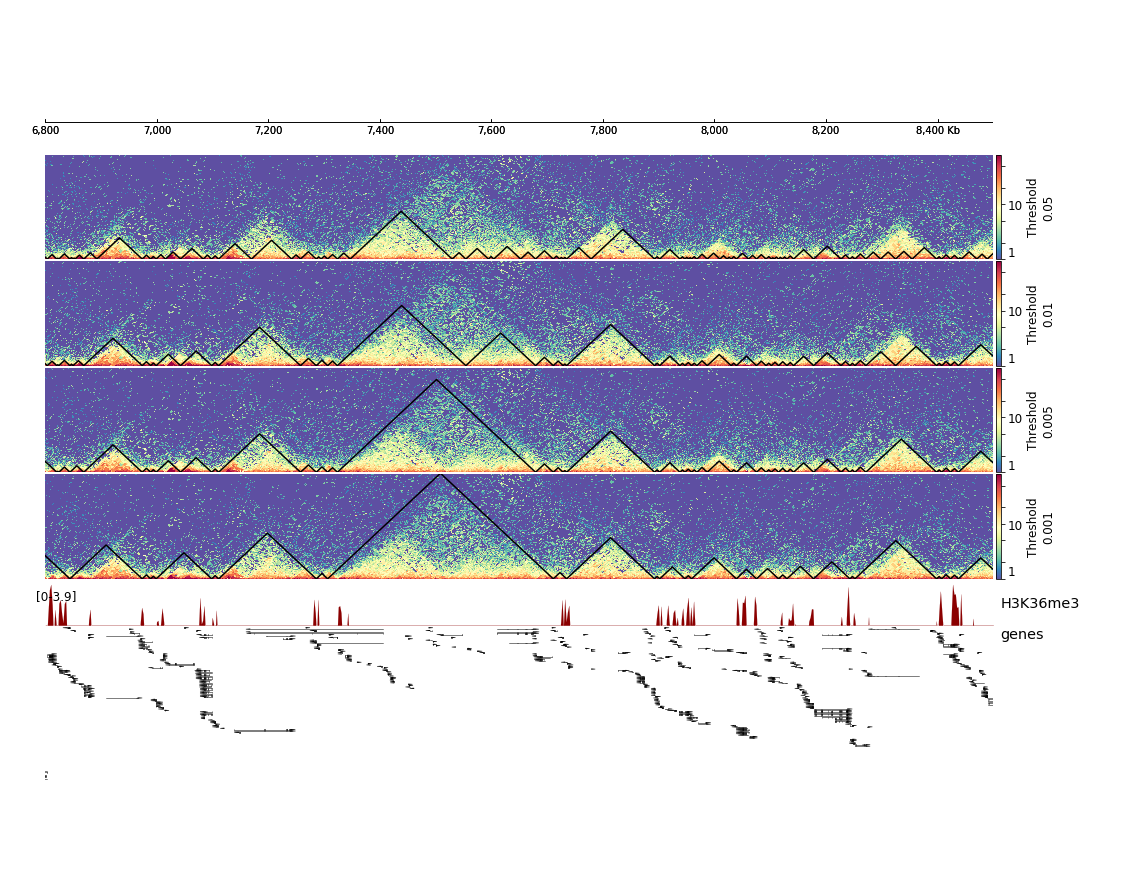
$ hicPlotTADs --tracks tracks.ini --region chrX:6800000-8500000 -o TAD_calling_comparison.png
- tracks.ini:
[x-axis]
fontsize=10

[hic]
file = myHiCmatrix.h5
title = Threshold 0.05
colormap = Spectral_r
depth = 400000
min_value = 1
max_value = 80
transform = log1p
boundaries_file = myHiCmatrix_min10000_max40000_step1500_thres0.05_delta0.01_fdr_domains.bed
x labels = yes
file_type = hic_matrix
show_masked_bins = no

[spacer]
width = 0.1

[hic]
file = myHiCmatrix.h5
title = Threshold 0.01
colormap = Spectral_r
depth = 400000
min_value = 1
max_value = 80
transform = log1p
boundaries_file = myHiCmatrix_min10000_max40000_step1500_thres0.01_delta0.01_fdr_domains.bed
x labels = yes
file_type = hic_matrix
show_masked_bins = no

[spacer]
width = 0.1

[hic]
file = myHiCmatrix.h5
title = Threshold 0.005
colormap = Spectral_r
depth = 400000
min_value = 1
max_value = 80
transform = log1p
boundaries_file = myHiCmatrix_min10000_max40000_step1500_thres0.005_delta0.01_fdr_domains.bed
x labels = yes
file_type = hic_matrix
show_masked_bins = no

[spacer]
width = 0.1

[hic]
file = myHiCmatrix.h5
title = Threshold 0.001
colormap = Spectral_r
depth = 400000
min_value = 1
max_value = 80
transform = log1p
boundaries_file = myHiCmatrix_min10000_max40000_step1500_thres0.001_delta0.01_fdr_domains.bed
x labels = yes
file_type = hic_matrix
show_masked_bins = no

[spacer]
width = 0.1

[bigwig]
file = /data/processing4/richard/ChIP-Seq_Embryos_Maria/H3K36me3_14c.bigwig
title = H3K36me3
color = darkred
min_value = 0
max_value = auto
width = 2
file_type = bigwig

[spacer]
width = 0.1

[genes]
file = /data/akhtar/group/ramirez/Drosophila_evol_comp/data/bedfiles/dm6/genes_sorted.bed
title = genes
color = black
width = 18
labels = on
type = genes
file_type = bed
This will result in the following plot where we see that the fourth set of hicFindTADs parameters with a threshold of 0.001 gives the best results in terms of TAD calling compared to the corrected Hi-C counts distribution and compared to the enrichment of H3K36me3, which is known to be enriched at TAD boundaries in Drosophila melanogaster.
Notes
In the _domains.bed output file, the 5th column contains the TAD-separation score at the boundary located at the start of domain.
The process to identify boundaries is as follows:
- call all local minima in the average TAD-score. Each local minima should be separated by at least min_boundary_distance. If this value is not given, it is set to the average bin size * 4
- for each local minima detected compute its p-value and then compute a q-value.
- for each local minima detected compute the ‘delta’ which is the difference between the mean TAD-score of the 10 bins before the minimum and the 10 bins after the minimum (excluding the min point)
- Keep only those minima with that fulfill the following criteria: the p-value (or q-value depending on the user selection) should be below the given threshold and the delta should be above the user defined threshold.
- everything between 2 consecutive boundaries is a TAD
For the computation of the p-values, the distribution of the z-scores at the ‘diamond’ above the local minimum is compared with the distribution of z-scores that are min_depth downstream using the Wilcoxon rank-sum test. Simarlty, the distribution of z-scores is computed with the z-scores min_dep upstream of the local mininum. The smallest of the two p-values is assigned to the local minimum.
If min_depth is not given, this is computed as bin size * 30 (if the bins are smaller than 1000), as bin size * 10 if the bins are between 1000 and 20.000 and as bin size * 5 if the bin size is bigger than 20.000.
If min_depth is not given, this is computed as bin size * 60 (if the bins are smaller than 1000), as bin size * 40 if the bins are between 1000 and 20.000 and as bin size * 10 if the bin size is bigger than 20.000.