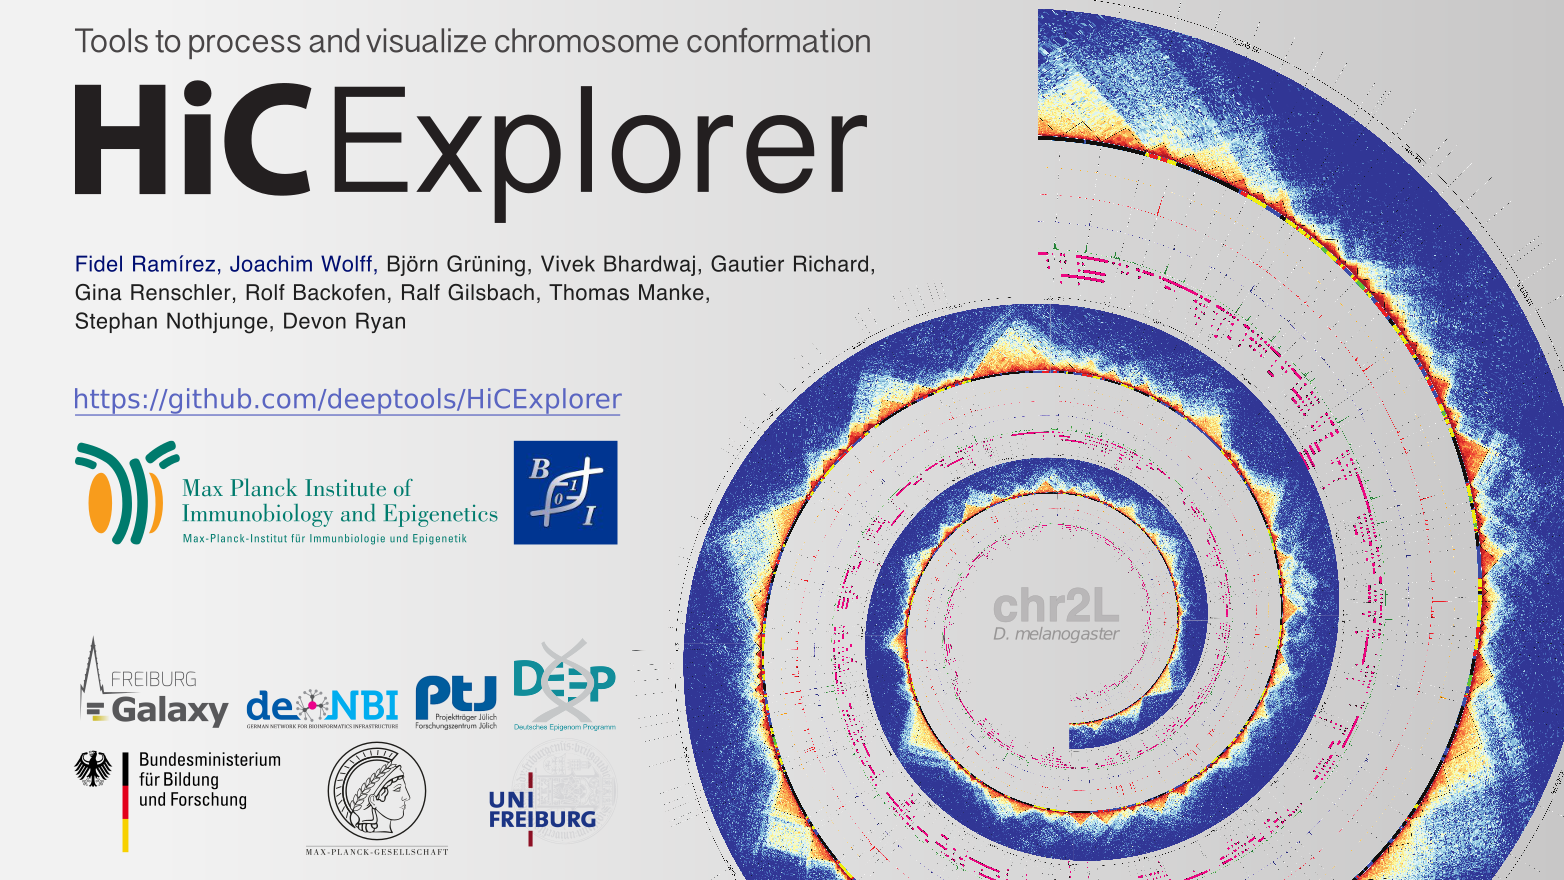
HiCExplorer
Set of programs to process, normalize, analyze and visualize Hi-C data
HiCExplorer addresses the common tasks of Hi-C data analysis from processing to visualization.

Availability
HiCExplorer is available as a command line suite of tools on this GitHub repository.
A Galaxy HiCExplorer version is directly available to users at http://hicexplorer.usegalaxy.eu. Training material is available at the Galaxy Training Network, while a Galaxy Tour is available here for users not familiar with this platform. Galaxy HiCExplorer is also available as a Docker image at the Docker Galaxy HiCExplorer GitHub repository. Finally, this Galaxy version is available on the Galaxy Tool Shed and on the corresponding GitHub repository.
The following is the list of tools available in HiCExplorer
tool |
description |
|---|---|
Identifies the genomic locations of restriction sites |
|
Creates a Hi-C matrix using the aligned BAM files of the Hi-C sequencing reads |
|
Estimates the quality of Hi-C dataset |
|
Plots QC measures from the output of hicBuildMatrix |
|
Uses iterative correction to remove biases from a Hi-C matrix |
|
Identifies enriched Hi-C contacts |
|
Computes and visualises the correlation of Hi-C matrices |
|
Identifies Topologically Associating Domains (TADs) |
|
Computes for A / B compartments the eigenvectors |
|
Computes a obs_exp matrix like Lieberman-Aiden (2009), a pearson correlation matrix and or a covariance matrix. These matrices can be used for plotting. |
|
Merges consecutive bins on a Hi-C matrix to reduce resolution |
|
Uses a BED file of domains or TAD boundaries to merge the bin counts of a Hi-C matrix. |
|
Plot the decay in interaction frequency with distance |
|
Plots a Hi-C matrix as a heatmap |
|
Plots TADs as a track that can be combined with other tracks (genes, signal, interactions) |
|
A plot with the interactions around a reference point or region. |
|
A tool that allows plotting of aggregated Hi-C sub-matrices of a specified list of positions. |
|
Adds Hi-C matrices of the same size |
|
Plots distance vs. Hi-C counts of corrected data |
|
Shows information about a Hi-C matrix file (no. of bins, bin length, sum, max, min, etc) |
|
Computes difference or ratio between two matrices |
|
Computes the average of multiple given regions, usually TAD regions |
|
visualization of hicAverageRegions |
|
Normalizes the given matrices to 0-1 range or the smallest read coverage |
|
Converts between different Hi-C interaction matrices |
|
Keeps, removes or masks regions in a Hi-C matrix |
|
Compare the loops with known peak protein locations |
|
Merges loops of different resolutions |
|
Compute the global compartmentalization signal |
|
Quality control for cHi-C data |
|
Background model computation for cHi-C analysis |
|
Computation of all viewpoints based on background model for cHi-C analysis |
|
Detection of significant interactions per viewpoint based on background model |
|
Compiling of target regions for two samples as input for differential analysis |
|
Differential analysis of interactions of two samples |
|
Plotting of viewpoint with background model and highlighting of significant and differential regions |
Getting Help
For all kind of questions, suggesting changes/enhancements and to report bugs, please create an issue on our GitHub repository
In the past we offered to post on Biostars with Tag hicexplorer : Biostars or on the deepTools mailing list. We still check these resources from time to time but the preferred way to communicate are GitHub issues.
Contents:
- Installation
- HiCExplorer tools
- Example usage
- News and Developments
- Release 3.2
- Release 3.1
- Release 3.0.2
- Release 3.0.1
- Release 3.0
- Release 2.2.3
- Release 2.2.2
- Release 2.2.1
- Release 2.2
- Publication
- Release 2.1.4
- Release 2.1.3
- Release 2.1.2
- Release 2.1.1
- Release 2.1
- Release 2.0
- Release 1.8.1
- Release 1.8
- Release 1.7.2
- Release 1.7
- Preprint introducing HiCExplorer is now online
- HiCExplorer wins best poster prize at VizBi2016
Citation
Please cite HiCExplorer as follows:
Fidel Ramirez, Vivek Bhardwaj, Jose Villaveces, Laura Arrigoni, Bjoern A Gruening,Kin Chung Lam, Bianca Habermann, Asifa Akhtar, Thomas Manke. “High-resolution TADs reveal DNA sequences underlying genome organization in flies”. Nature Communications, Volume 9, Article number: 189 (2018), doi: https://doi.org/10.1038/s41467-017-02525-w
Joachim Wolff, Vivek Bhardwaj, Stephan Nothjunge, Gautier Richard, Gina Renschler, Ralf Gilsbach, Thomas Manke, Rolf Backofen, Fidel Ramírez, Björn A Grüning. Galaxy HiCExplorer: a web server for reproducible Hi-C data analysis, quality control and visualization, Nucleic Acids Research, Volume 46, Issue W1, 2 July 2018, Pages W11–W16, doi: https://doi.org/10.1093/nar/gky504

This tool suite is developed by the Bioinformatics Unit at the Max Planck Institute for Immunobiology and Epigenetics, Freiburg and by the Bioinformatics Lab of the Albert-Ludwigs-University Freiburg, Germany.