hicDetectLoops
Computes enriched regions (peaks) or long range contacts on the given contact matrix.
usage: hicDetectLoops --matrix MATRIX --outFileName OUTFILENAME
                      [--peakWidth PEAKWIDTH] [--windowSize WINDOWSIZE]
                      [--pValuePreselection PVALUEPRESELECTION]
                      [--peakInteractionsThreshold PEAKINTERACTIONSTHRESHOLD]
                      [--pValue PVALUE] [--maxLoopDistance MAXLOOPDISTANCE]
                      [--minLoopDistance MINLOOPDISTANCE]
                      [--chromosomes CHROMOSOMES [CHROMOSOMES ...]]
                      [--region REGION] [--threads THREADS] [--help]
                      [--version]
Required arguments
- --matrix, -m
The matrix to compute the loop detection on.
- --outFileName, -o
Outfile name to store the detected loops. The file will in bedgraph format.
Optional arguments
- --peakWidth, -pw
The width of the peak region in bins. The square around the peak will include (2 * peakWidth)^2 bins.
Default: 6
- --windowSize, -w
The window size for the neighborhood region the peak is located in. All values from this region (exclude the values from the peak region) are tested against the peak region for significant difference. The square will have the size of (2 * windowSize)^2 bins
Default: 10
- --pValuePreselection, -pp
Only candidates with p-values less the given threshold will be considered as candidates. For each genomic distance a negative binomial distribution is fitted and for each pixel a p-value given by the cumulative density function is given. This does NOT influence the p-value for the neighborhood testing.
Default: 0.025
- --peakInteractionsThreshold, -pit
The minimum number of interactions a detected peaks needs to have to be considered. The number of interactions decreases with increasing genomic distances: peakInteractionsThreshold/log(genomic distance)
Default: 20
- --pValue, -p
Rejection level for Anderson-Darling test for H0. H0 is peak region and background have the same distribution.
Default: 0.01
- --maxLoopDistance
Maximum genomic distance of a loop, usually loops are within a distance of ~2MB.
Default: 2000000
- --minLoopDistance
Minimum genomic distance of a loop to be considered.
Default: 100000
- --chromosomes
Chromosomes to include in the analysis. If not set, all chromosomes are included.
- --region
The format is chr:start-end.
- --threads, -t
Number of threads to use, the parallelization is implemented per chromosome.
Default: 4
- --version
show program’s version number and exit
hicDetectLoops can detect enriched interaction regions (peaks / loops) based on a strict candidate selection, negative binomial distributions and Anderson-Darling tests.
The algorithm was mainly develop on GM12878 cells from Rao 2014 on 10kb and 5kb fixed bin size resolution.
Example usages
$ hicDetectLoops -m matrix.cool -o loops.bedgraph --maxLoopDistance 2000000 --windowSize 10 --peakWidth 6 --pValuePreselection 0.05 --pValue 0.05 --peakInteractionsThreshold 20
The candidate selection is based on the restriction of the maximum genomic distance, here 2MB. This distance is given by Rao 2014. For each genomic distance a negative binomial distribution is computed and only interaction pairs with a threshold less than pValuePreselection are accepted. Detected candidates need to have at least an interaction count of peakInteractionsThreshold / log(genomic distance). In a second step, each candidate is considered under its neighborhood. This neighborhood is defined by the windowSize parameter in the x and y dimension. In one neighborhood only one candidate can exist, therefore per neighborhood only the candidate with the highest peak values is accepted. As a last step, the neighborhood is split into a peak and background region (parameter ‘peakWidth’). The peakWidth can never be larger than the windowSize. However, we recommend for 10kb matrices a windowSize of 10 and a peakWidth of 6.
loops.bedgraph: x and y position of the loop and the p-value of Anderson-Darling test.
1 120000000 122500000 1 145000000 147500000 0.001
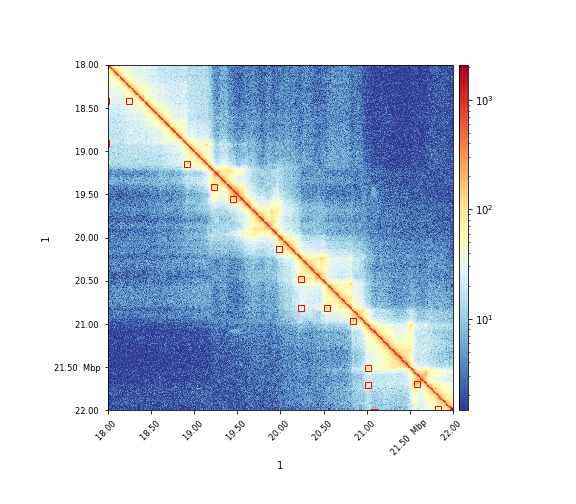
The results can visualized via hicPlotMatrix:
$ hicPlotMatrix -m matrix.cool -o plot.png --log1p --region 1:18000000-22000000 --loops loops.bedgraph