hicMergeMatrixBins
Background
Depending on the downstream analyses to perform on a Hi-C matrix generated with HiCExplorer, one might need different bin resolutions. For example using hicPlotMatrix to display chromatin interactions of a whole chromosome will not produce any meaningful vizualisation if it is performed on a matrix at restriction sites resolution. hicMergeMatrixBins address this issue by merging a given number of adjacent bins (precised after –numBins). To limit the loss of information, it is mandatory to perform hicMergeMatrixBins on matrices prior to any correction, and perform a correction after bin merging for downstream analyses using hicCorrectMatrix.
Usage example
Running hicMergeMatrixBins
Bellow, we will develop the example of a matrix to display at the whole X-chromosome scale and at the scale of a 1Mb region of the X chromosome. To do this, we will perform two different bin merging using hicMergeMatrixBins on an uncorrected matrix built at the restiction sites resolution using hicBuildMatrix. To do this, we run the two following command lines
$ hicMergeMatrixBins -m myMatrix.h5 -o myMatrix_merged_nb3.h5 -nb 3

$ hicMergeMatrixBins -m myMatrix.h5 -o myMatrix_merged_nb50.h5 -nb 50
Starting from a matrix myMatrix.h5 with bins of a median length of 529bp, the first command produces a matrix myMatrix_merged_nb3.h5 with bins of a median length of 1661bp while the second command produces a matrix myMatrix_merged_nb50.h5 with bins of a median length of 29798bp. This can be checked with hicInfo.
After the correction of these three matrices using hicCorrectMatrix, we can now plot them, myMatrix_corrected.h5, myMatrix_merged_nb3_corrected.h5 and myMatrix_merged_nb50_corrected.h5, at the scale of the whole X-chromosome and at the X:2000000-3000000 region to see the effect of bin merging on the interactions visualization.
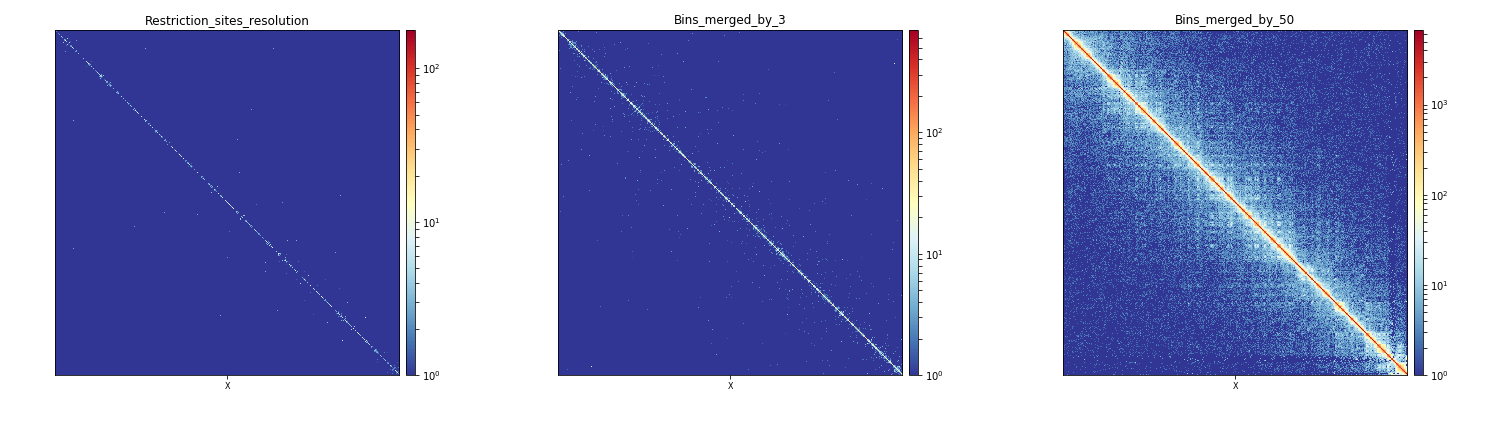
Effect of bins merging at the scale of a chromosome
$ hicPlotMatrix -m myMatrix_corrected.h5 \
-o myMatrix_corrected_Xchr.png \
--chromosomeOrder X \
-t Restriction_sites_resolution --log1p \
--clearMaskedBins

$ hicPlotMatrix -m myMatrix_merged_nb3_corrected.h5 \
-o myMatrix_merged_nb3_corrected_Xchr.png \
--chromosomeOrder X \
-t Bins_merged_by_3 --log1p \
--clearMaskedBins

 $ hicPlotMatrix -m myMatrix_merged_nb50_corrected.h5 \
-o myMatrix_merged_nb50_corrected_Xchr.png \
--chromosomeOrder X \
-t Bins_merged_by_50 --log1p \
--clearMaskedBins
When observed altogether, the plots produced by these three commands show that the merging of bins by 50 is the most adequate way to plot interactions for a whole chromosome in Drosophila melanogaster when starting from a matrix with bins of a median length of 529bp.
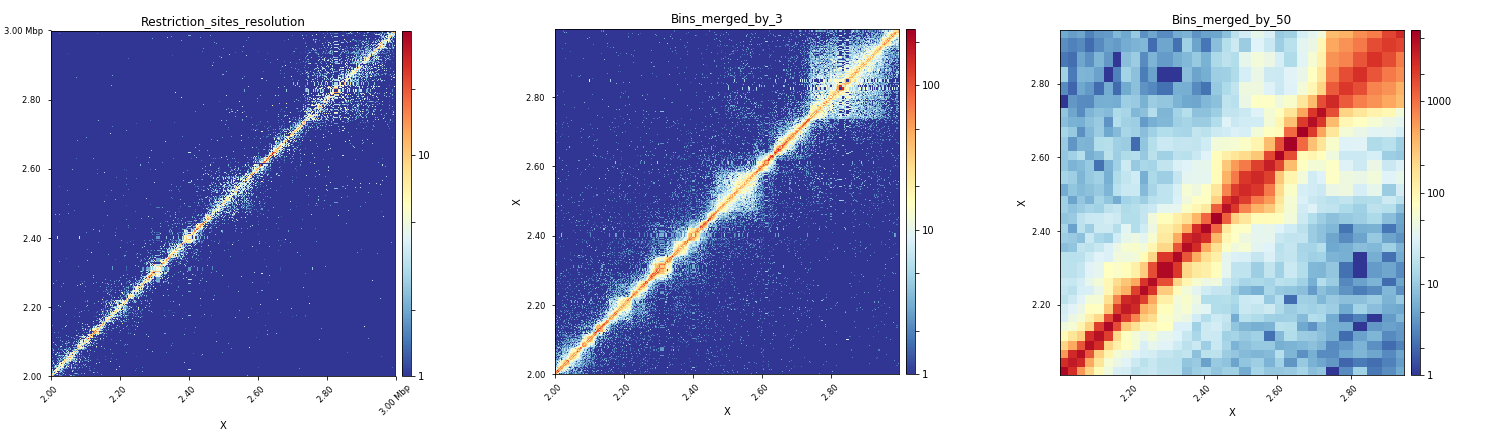
Effect of bins merging at the scale of a specific region
 $ hicPlotMatrix -m myMatrix_corrected.h5 \
-o myMatrix_corrected_Xregion.png \
--region X:2000000-3000000 \
-t Restriction_sites_resolution --log1p \
--clearMaskedBins

$ hicPlotMatrix -m myMatrix_merged_nb3_corrected.h5 \
-o myMatrix_merged_nb3_corrected_Xregion.png \
--region X:2000000-3000000 \
-t Bins_merged_by_3 --log1p \
--clearMaskedBins

 $ hicPlotMatrix -m myMatrix_merged_nb50_corrected.h5 \
-o myMatrix_merged_nb50_corrected_Xregion.png \
--region X:2000000-3000000 \
-t Bins_merged_by_50 --log1p \
--clearMaskedBins
When observed altogether, the plots produced by these three commands show that the merging of bins by 3 is the most adequate way to plot interactions for a region of 1Mb in Drosophila melanogaster when starting from a matrix with bins of a median length of 529bp.