hicCorrelate
Background
hicCorrelate is a dedicated Quality Control tool that allows the correlation of multiple Hi-C matrices at once with either a heatmap or scatterplots output.
Usage example
Below, you can find a correlation example of uncorrected Hi-C matrices obtained from Drosophila melanogaster embryos, either wild-type or having one gene knocked-down by RNAi.
$ hicCorrelate -m Dmel_wt_1.h5 Dmel_wt_2.h5 Dmel_kd_1.h5 Dmel_kd_2.h5 \
--method=pearson --log1p \
--labels Dmel_wt_1 Dmel_wt_2 Dmel_kd_1 Dmel_kd_2 \
--range 5000:200000 \
--outFileNameHeatmap Dmel_heatmap --outFileNameScatter Dmel_scatterplot \
--plotFileFormat png
Heatmap
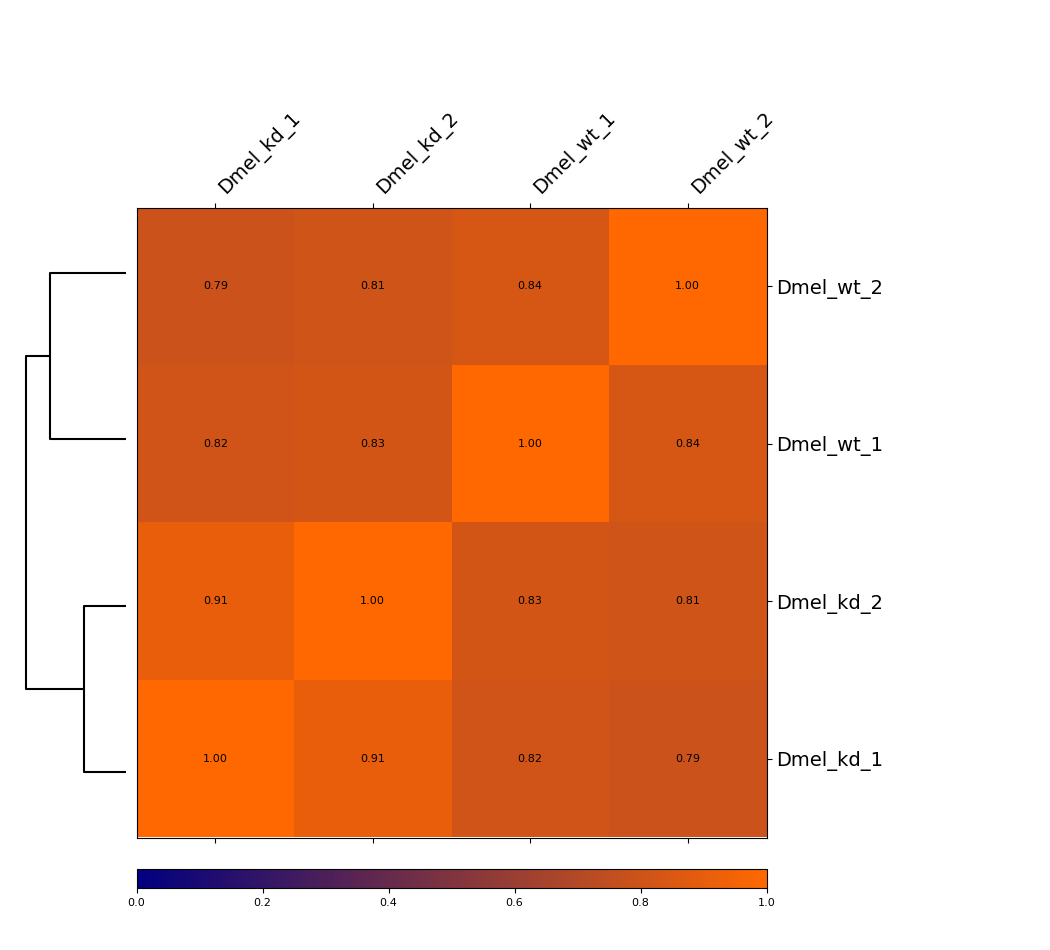
This example is showing a heatmap that was calculated using the Pearson correlation of un-corrected Hi-C matrices with a bin size of 6000 bp. The dendrogram indicates which samples are most similar to each other. You can see that the wild-type samples are seperated from the knock-down samples. The second option we offer is calculating the Spearman correlation.
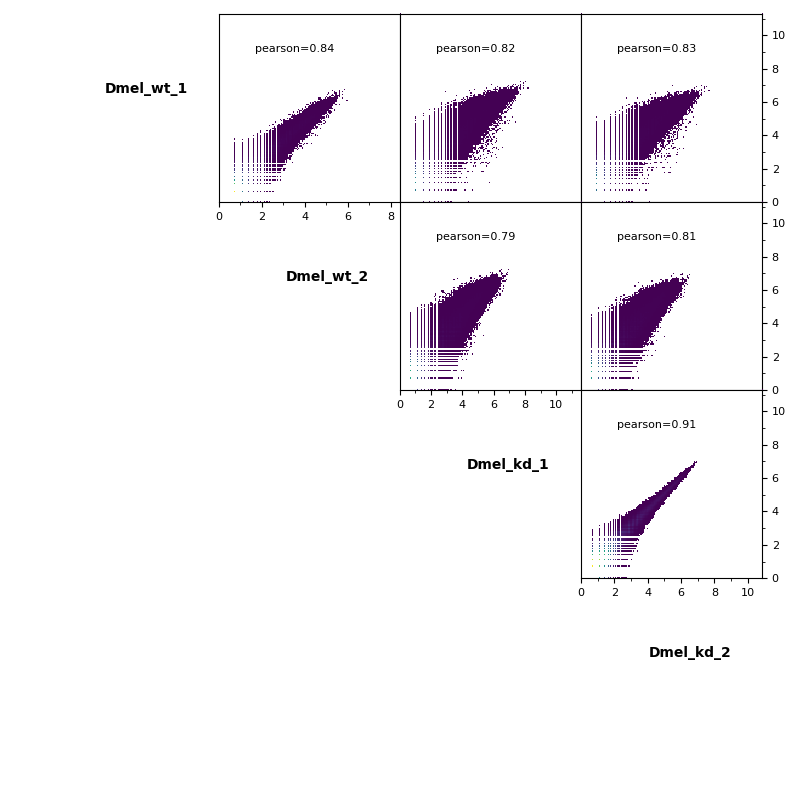
Scatterplot
Additionally, pairwise scatterplots comparing interactions between each sample can be plotted.