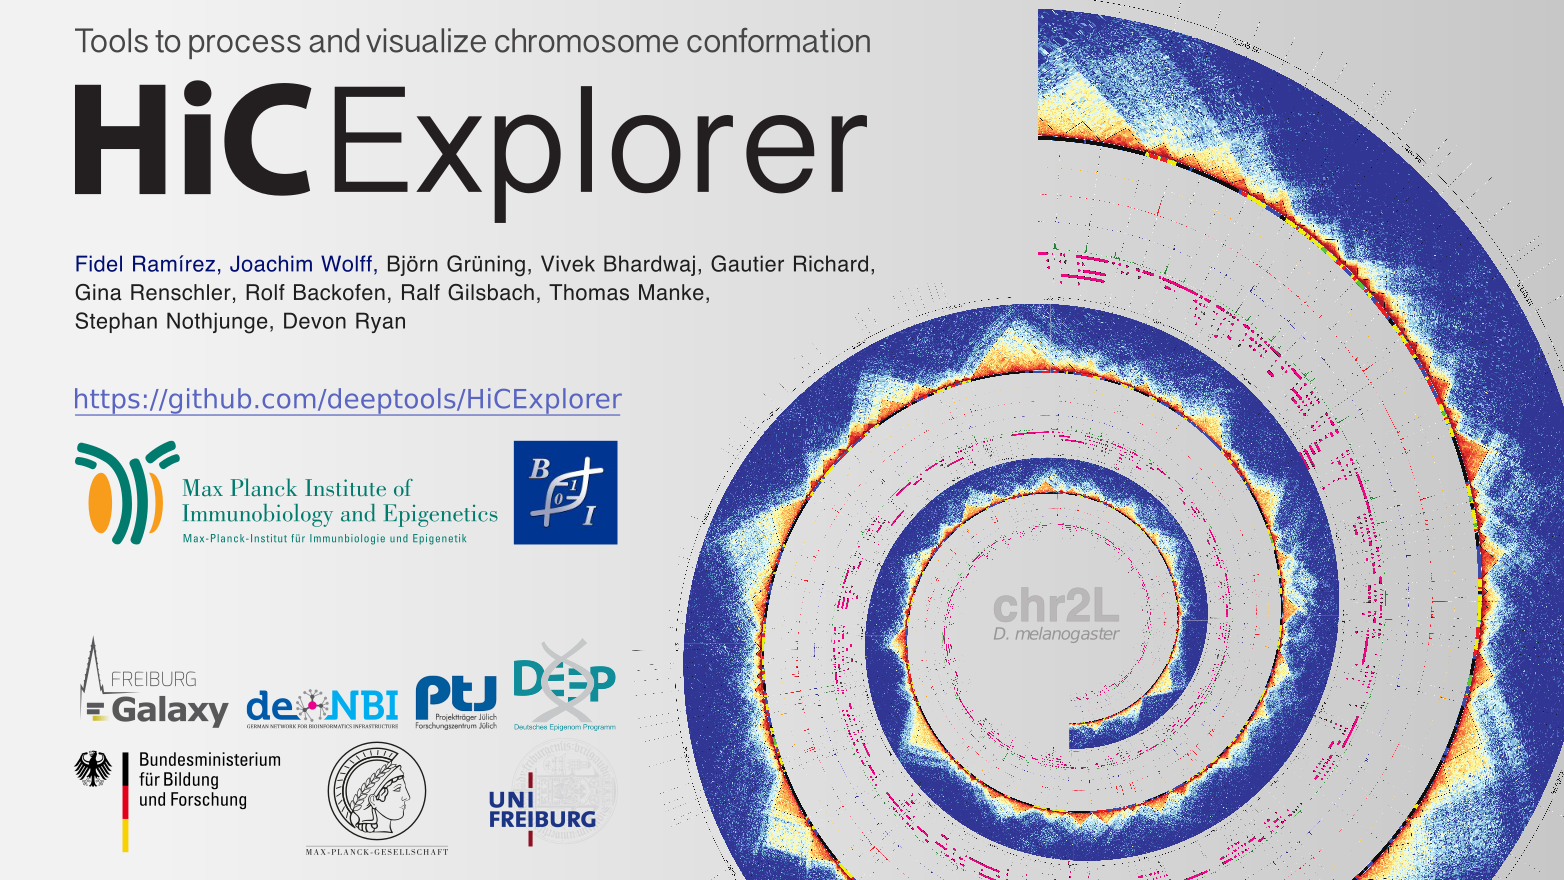
HiCExplorer
Set of programs to process, normalize, analyze and visualize Hi-C data
HiCExplorer addresses the common tasks of Hi-C data analysis from processing to visualization.

Availability
HiCExplorer is available as a command line suite of tools on this GitHub repository.
A Galaxy HiCExplorer version is directly available to users at http://hicexplorer.usegalaxy.eu. Training material is available at the Galaxy Training Network, while a Galaxy Tour is available here for users not familiar with this platform. Galaxy HiCExplorer is also available as a Docker image at the Docker Galaxy HiCExplorer GitHub repository. Finally, this Galaxy version is available on the Galaxy Tool Shed and on the corresponding GitHub repository.
The following is the list of tools available in HiCExplorer
| tool | description |
|---|---|
| findRestSites | Identifies the genomic locations of restriction sites |
| hicBuildMatrix | Creates a Hi-C matrix using the aligned BAM files of the Hi-C sequencing reads |
| hicQC | Plots QC measures from the output of hicBuildMatrix |
| hicCorrectMatrix | Uses iterative correction to remove biases from a Hi-C matrix |
| hicFindEnrichedContacts | Identifies enriched Hi-C contacts |
| hicCorrelate | Computes and visualises the correlation of Hi-C matrices |
| hicFindTADs | Identifies Topologically Associating Domains (TADs) |
| hicPCA | Computes for A / B compartments the eigenvectors |
| hicTransform | Computes a obs_exp matrix like Lieberman-Aiden (2009), a pearson correlation matrix and or a covariance matrix. These matrices can be used for plotting. |
| hicMergeMatrixBins | Merges consecutive bins on a Hi-C matrix to reduce resolution |
| hicMergeTADbins | Uses a BED file of domains or TAD boundaries to merge the bin counts of a Hi-C matrix. |
| hicPlotDistVsCounts | Plot the decay in interaction frequency with distance |
| hicPlotMatrix | Plots a Hi-C matrix as a heatmap |
| hicPlotTADs | Plots TADs as a track that can be combined with other tracks (genes, signal, interactions) |
| hicPlotViewpoint | A plot with the interactions around a reference point or region. |
| hicAggreagteContacts | A tool that allows plotting of aggregated Hi-C sub-matrices of a specified list of positions. |
| hicSumMatrices | Adds Hi-C matrices of the same size |
| hicPlotDistVsCounts | Plots distance vs. Hi-C counts of corrected data |
| hicExport | Export matrix to text formats |
| hicInfo | Shows information about a Hi-C matrix file (no. of bins, bin length, sum, max, min, etc) |
| hicCompareMatrices | Computes difference or ratio between two matrices |
| hicLog2Ratio | Computes the log2 ratio between two matrices. |
Getting Help
- For general questions, please use Biostars with Tag hicexplorer : Biostars
- For specific questions and feature requests, use the deepTools mailing list
- For suggesting changes/enhancements and to report bugs, please create an issue on our GitHub repository
Citation
Please cite HiCExplorer as follows:
Fidel Ramirez, Vivek Bhardwaj, Jose Villaveces, Laura Arrigoni, Bjoern A Gruening,Kin Chung Lam, Bianca Habermann, Asifa Akhtar, Thomas Manke. “High-resolution TADs reveal DNA sequences underlying genome organization in flies”. Nature Communications, Volume 9, Article number: 189 (2018), doi: https://doi.org/10.1038/s41467-017-02525-w

This tool suite is developed by the Bioinformatics Unit at the Max Planck Institute for Immunobiology and Epigenetics, Freiburg.