hicPlotMatrix
Details
hicplotMatrix takes a Hi-C matrix and plots the interactions of all or some chromosomes.
Examples
Here’s an example of Hi-C data from wild-type D. melanogaster embryos.
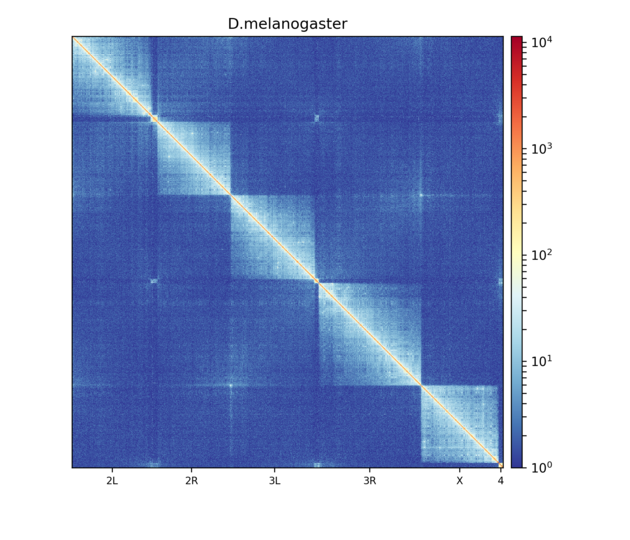
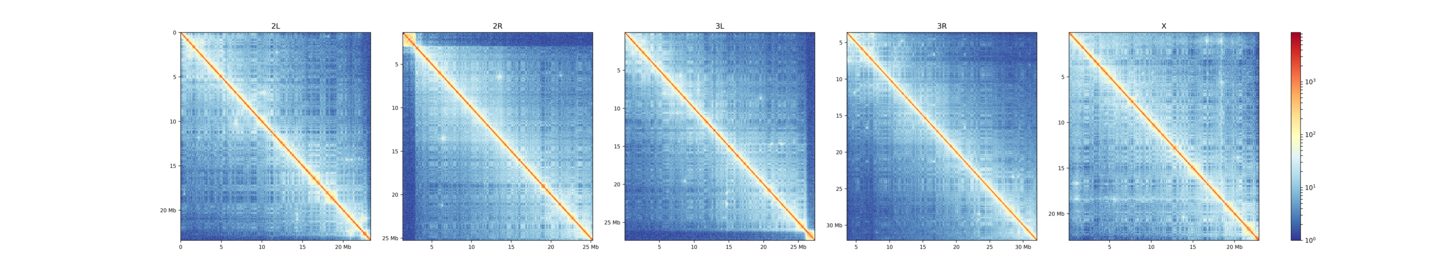
This plot shows contacts of a Hi-C matrix that was merged to a 25 kb bin size using hicMergeMatrixBins. Alternatively, chromosomes can be plotted separately.
$ hicPlotMatrix -m Dmel.h5 -o hicPlotMatrix.png \
-t 'D.melanogaster (--perChromosome)' --log1p \
--clearMaskedBins --chromosomeOrder 2L 2R 3L 3R X --perChromosome